Real time Access to Your Data
Visualization Provides Actionable Information Everyday Tracking Data
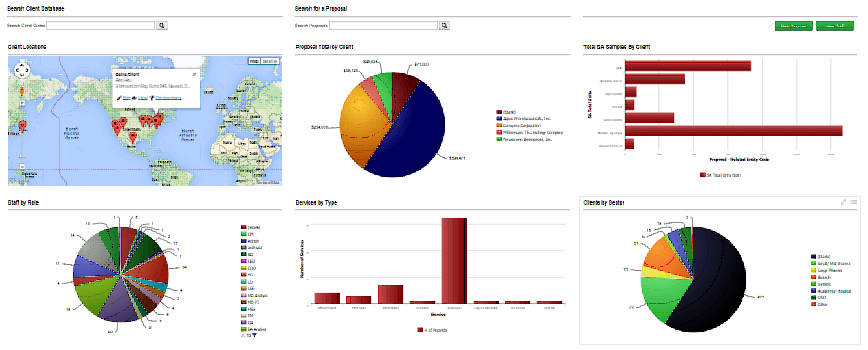
The Informatics Platform
The use of dashboards and rich and initiative visualizations allows users the ability to see outliers, patterns, and correlations that are not visible from spreadsheets. Interactive charts allows user to drill down to details for decision making capability that teams can just consume as part of everyday job without having to manipulate or manage all of those operational transactions. With powerful embedded analytics in the platform, performance metrics are automatically derived and visualized from everyday tracking data.
Real time Access
to Your Data
A good planning, tracking, and metric measurement system is very important. The platform can be customized using cost effective technology to provide integrated solutions across many operational areas supporting project conduct. The data framework allows for convergence of multiple data sources, to allow for enriched and insightful data views.
Find us on Facebook
Social Media

